Drop the PA from CAPA

ISO_logo

The new revision of ISO 9001 is going to be released later this year. One of the changes proposed, that piqued my interest, was removal of the Preventive Action section. Preventive Action is “replaced” with Risk Based Thinking.

Preventive Action is proactive in nature. So is risk based thinking. Since my field is medical devices, risk based thinking is deeply engrained in me. It is my understanding that this revision is proposed to create a management system that is risk based.

One of the ways that I have used the PA of CAPA is to identify potential opportunities to implement what we learned from the CAPA. This could be similar products, processes or designs. This is similar to Yokoten in Lean Manufacturing. Jon Miller at Gemba Panterai calls this as “Horizontal Deployment”.

Yokoten means “horizontal deployment” and refers to the practice of copying good results of kaizen in one area to other areas.

The new revision does not take away this meaning. The new revision has in fact moved the thought of risk based thinking to Planning section. Thus, the intent is to spread the idea of risk based management throughout the organization.

As mentioned earlier, risk based thinking is proactive by definition. When properly done, risk based thinking can reduce the nonconformity occurrences, thus reducing the need for corrective actions. Corrective actions are reactive in nature. Risk based thinking leads to more preventive actions throughout the organization.

Paraphrasing heavily from the proposed changes;

When planning for QMS, the organization shall determine the risks and opportunities that need to be addressed to (among other things) prevent or reduce undesired effects.

It will be interesting to see how this will be handled with ISO 13485 standard.

Keep on learning…
Wilk’s One Sided Tolerance spreadsheet for download

wilks

I have created a spreadsheet that allows the user to calculate the number of samples needed for a desired one-sided tolerance interval at a desired confidence level. Additionally, the user can also enter the desired order for the sample size.

For example, if you have 93 samples, you can be 95% confident that 95% of the population are above the 2nd lowest value samples. Alternatively, you can also state that 95% of the population is below the 2nd highest value of the samples.

Here is an example of this in use.

If there is an interest, I can also try creating a two sided tolerance interval spreadsheet as well.

The keen student might notice that the formula is identical to the Bayes Success Run Theorem when the order p =1.

The spreadsheet is available for download here. Wilks one sided

Keep on learning…

Spirit of Buddha – Why do lean implementations fail?

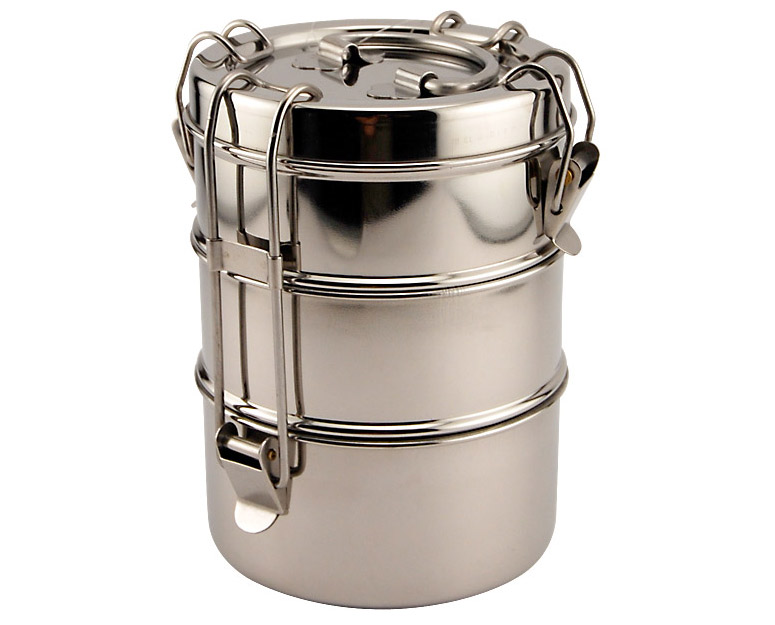
tiffin box

There have been multiple studies about why lean implementations fail. Why is it so hard for organizations to replicate Toyota’s success when implementing its Toyota Production System?

Hajime Oba, a Toyota veteran was once asked why other organizations cannot replicate Toyota’s success. He responded with an analogy that it is like trying to create a Buddha image without having the spirit of Buddha inside. In other words, other companies are trying to create a system of Lean or Toyota Production System that appears the same but does not have “the soul” in it. They recreate the elements including Kanban, JIT, Jidoka, one piece flow etc. but they simply cannot recreate the spirit or the soul. This is a great analogy.

What is the spirit or the soul of lean implementation? In my thinking, this is the culture. The culture is the cement that brings all the elements of the system together, completely aligned in one direction, which is the company’s vision. This is homogenous in nature, meaning that if you take a sample from anywhere in the company (upper management, middle management, etc.), you will get the same vision. The common goal is engrained in everybody’s mind. If you ask the operator on the floor or the CEO, you get the same answer. Everybody has the spirit within them. They do not strive for local optimization. They strive for the system optimization.

This can be also explained, in a way, with correlation and causation. As it is repeated again and again, correlation does not imply causation. There is a high correlation  with the presence of all the tools like Kanban, JIT, Jidoka, Kaizen thinking etc. with many successful companies. However, this does not imply that the success is caused by those tools. In other words, a correlation marked by the presence of the tools does not imply causation for success. What is missing? The culture, or the spirit, or as Mr. Oba put it – the spirit of Buddha. This is like having the body of a car without its engine, the driving force.

This brings to my mind the accomplishments of one amazing organization. This organization performs 400,000+ transactions a day. The total number of employees is approximately 5000. They have not had any strike in their 120+ years of existence. They have a minimal attrition rate. Their error rate is 1 in 16 million (better than six sigma). They do not use any of the new technologies like an ERP system or bar coding. What they do have is a manual coding of all containers. They get a 100% customer satisfaction rating, year after year. This is the Mumbai Dabbawala Association. They are as they call themselves, a flat organization with no silos. The spirit is very much alive in their organization. Their goal is bring the “lunch box” to the customer and back, on a daily basis at the specified time and location. Come rain or shine, traffic or no traffic in one of the most populated cities in the world. Each employee knows their vision and purpose, and works towards that. You can learn about them more here and here or here.

Keep on learning and keep the spirit alive…

Ship of Theseus and Process Validation

1024px-Model_of_a_greek_trireme

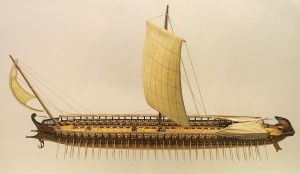
There is a great Greek paradox/puzzle called the Ship of Theseus. There are multiple versions and derivations to it. My favorite version is as follows (highly watered down);

Theseus bought a new ship. Each day he replaced one part of the ship. Plank by plank, and sail by sail and finally oar by oar. Finally no part of the original ship remained. Now the paradox is this – is the ship same as the original ship now that every part has been replaced? This is a great thought experiment about identity and understanding of self. If we go one step further and build a new ship with all the parts that were replaced from the original ship, is the new ship the same as the original ship?

When I read about this great paradox, somehow my mind started thinking about process validation. We get a new piece of equipment, say a pouch sealer, and during the course of multiple years, the equipment gets many of the parts replaced and many of the parts get worn down. Is the sealer the same as the original sealer? Is the original validation still valid?

This is where two main aspects of the process validation are important.

1) Maintaining the validated state; and 2) Revalidation Criteria.

Maintaining the validation state includes proper monitoring of the process, once it is qualified, to ensure that the process is in a state of control. For example, for a sealer validation, we might perform seal strength testing and visual inspection based on a frequency and defined criteria. Any adverse results shall be reviewed and rectified.

The revalidation criteria can be based on predetermined criteria as well. Some examples are below.

1) Major parts of the equipment replaced.

2) Equipment relocated to a new facility.

3) Equipment not in use for more than a year.

4) Significant changes to the process like raw material change.

5) Negative trends in Quality.

Both maintaining the validated state and revalidation requirements must be part of a process validation protocol.

Keep on learning…

8 Things I learned from Spock

Spock_vulcan-salute

Spock (Leonard Nimoy) is no more. The character of Spock from Star Trek has had a huge impact on many peoples’ lives. Leonard Nimoy will be deeply missed.

Here are 8 things that I learned from Spock.

1) If you do not have enough information, say that you do not have enough information or that your hypothesis is based on the limited information. As a Science Officer, he very well knew that he had to give the best possible opinion at all times. But he was open about his lack of information to form an effective hypothesis. For example, Spock would respond “I simply do not have enough data to form an opinion”, to Kirk’s “Opinion, Mr. Spock?” question. Kirk would then follow up with “Speculation, Mr. Spock.”.

2) Do not mix emotions with your hypothesis. In other words, try to eliminate or minimize confirmation bias. This was what separated Spock from Bones in the show.

3) Always have an open mind. Spock always remarked “Fascinating” anytime he came across something new. This also tells us to minimize our confirmation bias.

4) Look for patterns to form your hypothesis. After all, that is the role of a Science Officer.

5) Try to think rationally. Spock put a lot of emphasis on logic.

6) Always be abreast with the latest in your field. This was essential for Spock as a Science Officer. Always keep on learning.

7) Things are not always black and white. Spock learned this from Kirk. Kirk was always willing to challenge the status quo.

8) Improbable things can happen. As Spock said “It would be illogical to assume all conditions remain stable.” With enough iterations, even highly unlikely events can happen.

Thank you and Good Bye, dear Leonard Nimoy.

Keep on learning…

Calculating Lead Times in a Value Stream Map

I was asked a question recently about the lead time calculations in a Value Stream Map. The question was specifically how the lead time is calculated.

There are two ways, that I have seen, of calculating lead times for value stream mapping. They both produce different results.

1) The first one is the one in “Learning to See”. Here the lead time is calculated as follows. Lead Time = Inventory/Daily Demand. There is no relationship with the consumption rate at the subsequent station. If the WIP is 1000 and the daily demand is 100, the lead time is 10 days. The assumption is that the inventory will be used up in only 10 days. This produces an inflated value for lead time and is not the true current state.

2) Calculation of Lead Time based on Little’s Law. To me, this is more realistic. Here the lead time is calculated as follows. Lead Time = WIP * Cycle Time of subsequent station. I know there is a lot of confusion regarding this.  Think of lead time calculation as the future tense. With the same example above, if the WIP is 1000 and cycle time at the station is 60 seconds, the lead time is 60000 seconds or 1000 minutes. Assuming 460 minutes in a day, this equates to 2.17 days (1000/460). In other words, lead time calculation is based on consumption rate.

The only thing to keep in mind with the second calculation is with the inventory we have at the last stage (Finished Goods). The lead time for this will be calculated as Inventory/Daily Requirement. This is because the customer is going to consume this at the rate of daily requirement.

In the end, please note that, “By overanalyzing the tool, don’t overlook the purpose of the tool.”

Keep on learning…

Understanding the void

As a data scientist or a quality professional, one should understand the whole picture. Sometimes this means that you have to gain information from what is there as well as what is not there. I like to call this the void.

A great story that comes to my mind regarding this is from a talk from Jeffrey S. Rosenthal. He also posted this in a great article called “I am biased, You are biased“.

” During World War II, the U.S. Air Force wanted to strategically reinforce the hull plating of its fighter planes to better withstand enemy fire — but which parts of the plane should be reinforced? Charts and graphs were carefully constructed, showing the location of bullet holes on returning aircraft. The military then decided to consult a statistician — always a clever move. Professor Abraham Wald immediately realised that those graphs were based on a biased sample: they only included data for the planes which actually returned from battle. The real issue was the location of bullet holes on the planes which were shot down and never made it home. The military wisely followed Wald’s advice, to reinforce those parts of the hull that came back clean and bullet-free — those were the places where any shots would be fatal”

Keep on learning…