Defining “worst-case” for Medical Device packaging

Sterile-Eo

I have an ongoing interest in Medical Device packaging. When I started at my current job a while back, my manager told me that the packaging operation is most critical operation for a sterile Medical Device. The product quality does not matter if the device is not provided sterile for the end user. The qualifications of new packaging configuration and the packaging process soon became my areas of interest.

The concept of “worst-case” is rooted in product reliability and good product design practices. The applicable industry standards for packaging Medical Devices are ISO 11607 parts 1 and 2. ISO 11607 part 1 has the following section detailing the use of “worst-case” product configuration for qualifying a packaging system.

“When similar medical devices use the same packaging system, a rationale for establishing similarities and identifying the worst-case configuration shall be documented. As a minimum, the worst-case configuration shall be used to determine compliance with this part of ISO 11607.”

For a Medical device design engineer or a packaging engineer, this determination of the worst-case comes natural. It is based on engineering judgment and intuition. However, one might find it easier if this can be documented objectively. The following matrix might be useful to document the worst-case configuration. Perhaps one can utilize a scoring system (1 through 5, where 1 -> Best case, and 5 -> Worst case) for each of the items detailed in the table below. Thus, the product with the highest score can be determined to be the worst-case configuration.

# Item Comments
1 Sterilization 2X sterilized represents worst case
2 Sealing Low setting or edge of failure represent worst case
3 Mass Heaviest product represents worst case
4 Size Bulkiest represents worst case
5 Product geometry Sharp corners represents worst case
6 IFU Largest, heaviest, stapled IFU represents worst case
7 Product configuration Most number of components inside represents worst case
8 Shipper quantity Most number of units in the shipper represents worst case
9 Shipper compactness Maximum room for pouches to move around represents worst case
10 Number of pouches inside sterile barrier Maximum number of pouches represents worst case
11 Compactness inside sterile barrier Maximum room inside between product and sterile barrier represents worst case
12 Pouch Used Largest Pouch (largest pouch has largest seal area) represents worst case
13 Shipper Box Burst Strength Low strength shipper box represents worst case

Please note the worst-case for qualification tests may not always represent real life scenarios. However, qualifying using the worst-case provides assurance that the product can meet real life scenarios.

The scoring sheet sample can be downloaded here (worst-case score sheet).

Disclaimer: Please note that this post is purely based on my opinion and not to be used as advice. I shall not be responsible for any possible outcomes. Please use at your own discretion.

Yin and Yang in Root Cause Analysis

Yin_and_Yang.svg

There is a balance that exists in root cause analysis that is Yin and Yang. In Chinese philosophy, Yin and Yang represents the harmonious balance between seemingly contradictory forces. Light is Yang, darkness is Yin. Hot is Yang, cold is Yin. Top of a hill is Yang, valley of the hill is Yin. The typical representation of Yin and Yang has the white section as Yang and the black section as Yin.

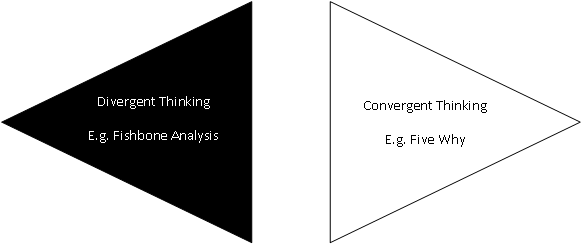
The root cause analysis process can be represented by the simple schematic below:

yin yang con div

Once the problem statement is made, one should use divergent thinking to gather more data/information and identify the potential sources of a problem. This should be followed by convergent thinking where one focuses on the true root cause(s). One might use Fishbone diagram as the form of divergent thinking, and five why as the convergent thinking.

Divergent thinking is expansive in nature and lacks focus, thus it is Yin. Convergent thinking, on the other hand is zooming in and direct in nature, thus it is Yang. As with anything else in nature, a good root cause analysis process should have at least one cycle of divergent thinking and convergent thinking. The approach of Yin and Yang creates a complete/whole root cause analysis.

Jumping to conclusions is just Yang. The absence of Yin makes this an imbalanced and wrong approach. As noted above, one may use multiple cycles of divergent thinking followed by convergent thinking. Think of this as a rinse process, purifying your thinking process with each cycle. This will provide clarity in your investigation, and prevent biases that water down your efforts to fix the problem.

As you may have noted, each half (Yin or Yang) also has a dot corresponding to the opposite color. This indicates that within each section, nothing is complete. In my humble opinion, this is similar to the Japanese thinking of wabi-sabi. That is, even within the Yin, it is not completely Yin. There is a dot of Yang in it. Even when we are doing divergent thinking, we are going in a certain direction. Even when we are doing convergent thinking, we are still remaining open.

Always keep on learning…

Nash Equilibrium and some strategies to cope

nash

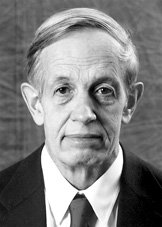
Although the world has lost a great and beautiful mind in John Nash, his concepts and theories are very much alive in this world. He and his wife were tragically killed in an automobile accident in New Jersey last week.

John Nash is the Nobel prize winning genius behind the “Nash Equilibrium”. He showed that every game played between two or more players will always achieve a stable state, from which either player will only incur further losses if something else is played. Thus, they have reached the rational play, knowing what the other player’s strategy is and there is no point in changing their strategy based on what they know of their opponent’s strategy. This does not mean that this is the play where they can maximize their gains. The Nash equilibrium may not always represent the best outcome for either player.

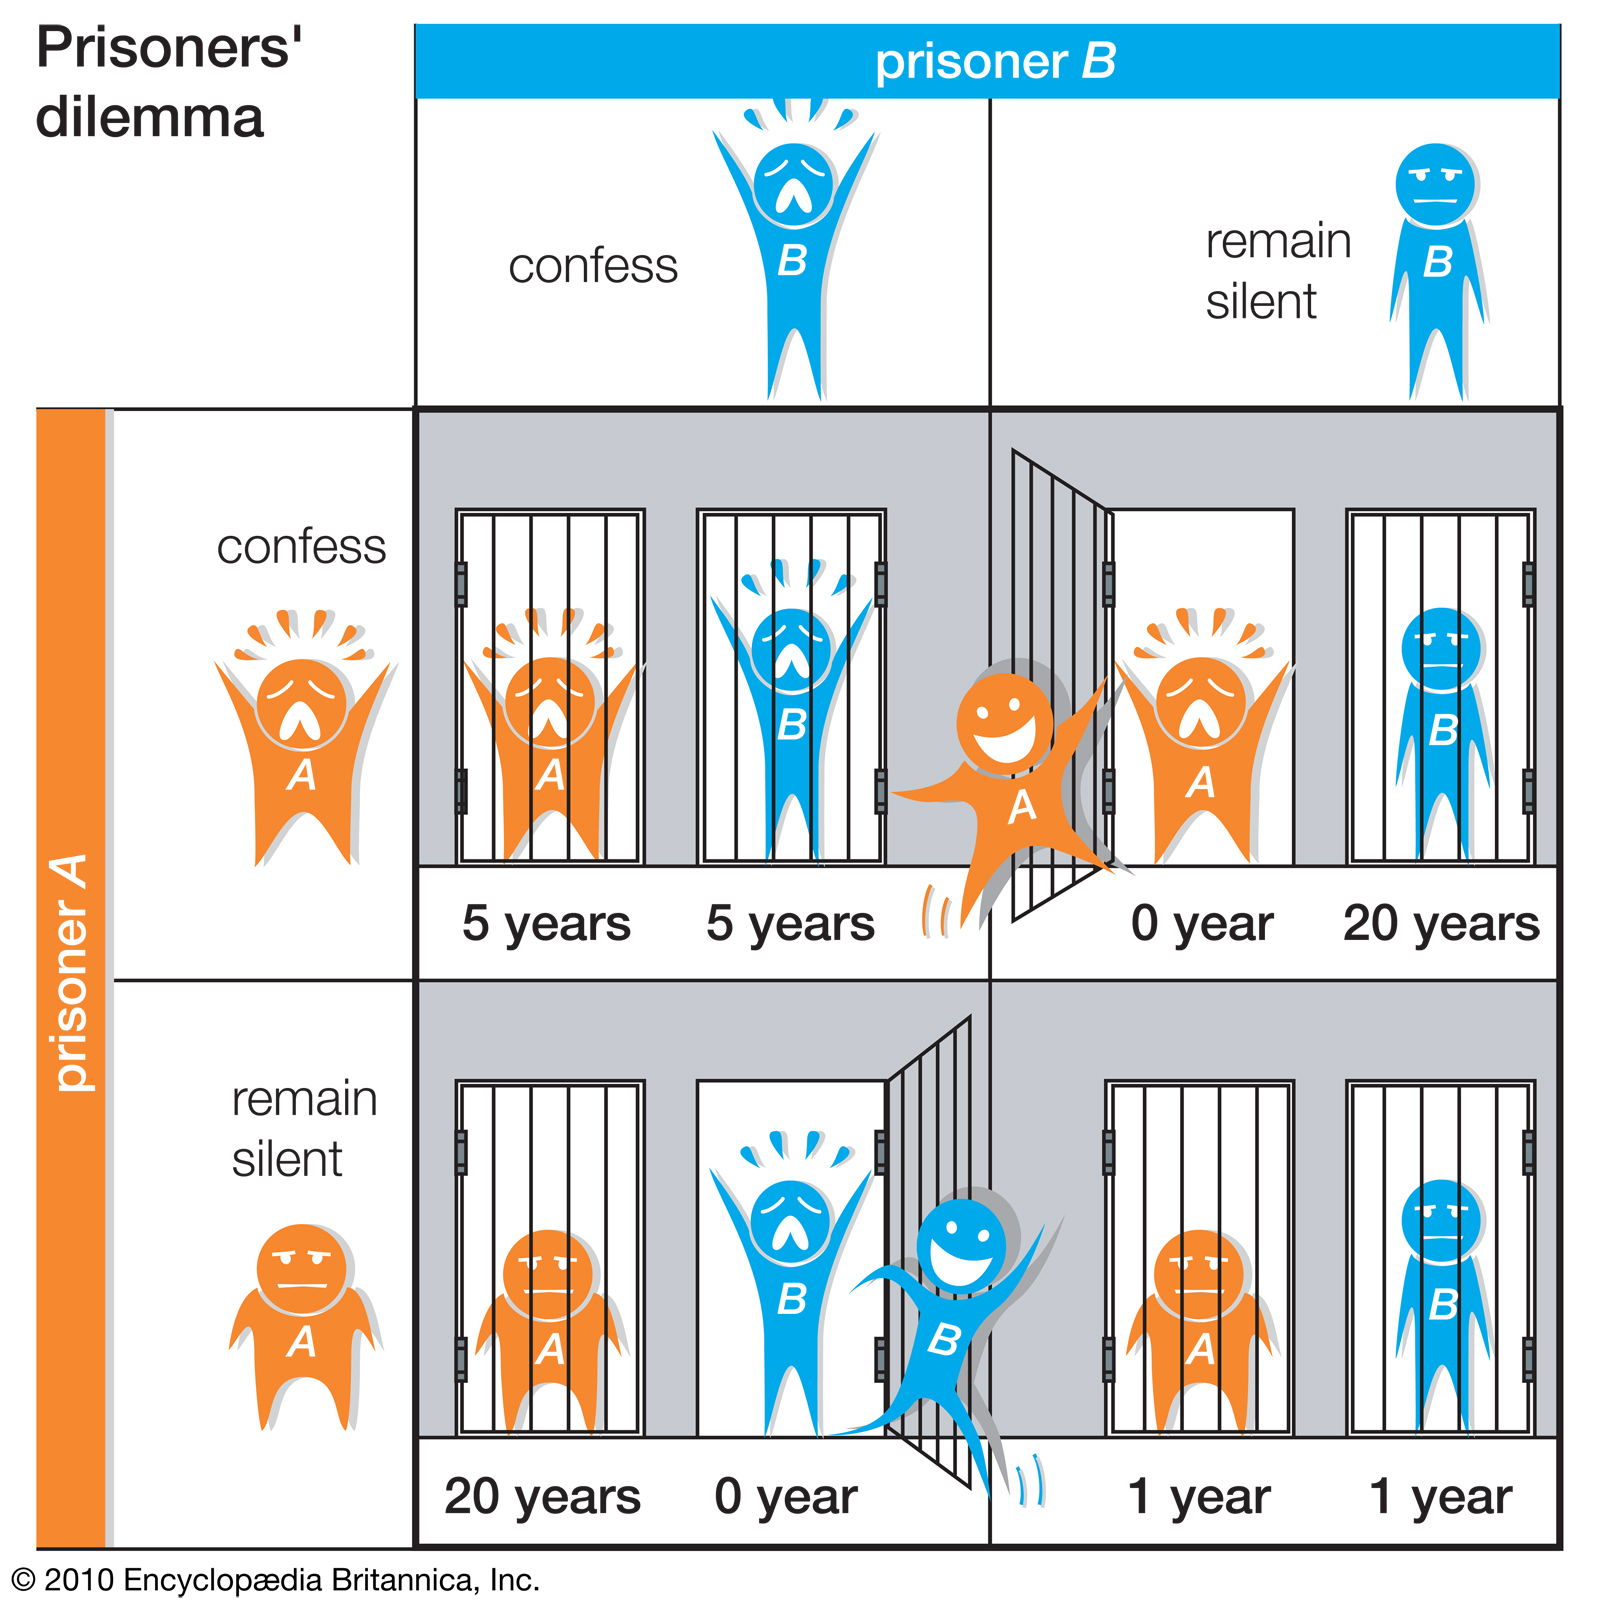
For example, in the famous Prisoner’s Dilemma game, the Nash Equilibrium represents the state where both players should confess. This play is not the one where either party can maximize their gains, but this is the play where they minimize their losses based on what the other player is playing. If they both remain silent, they both get 1 year each. However, if one confesses and the other remains silent, the one confessing gets 0 years. And the one remaining silent gets 20 years. Thus, no matter what, the “rational choice” is to confess. Sadly, the mutually beneficial state of remaining silent is not the best rational choice here.

prisoners_dilemma

Nash’s succinct paper is available here. http://web.mit.edu/linguistics/events/iap07/Nash-Eqm.pdf

In a non-cooperative situation, Nash Equilibrium will almost always result in a less than desired state. In the case of the prisoner’s dilemma example above, the values (how many years) were chosen for explanation. These values are called “utilities”. Sometimes, this is a personal preference. For example, if there are cars parked in the street coming to my house, there is space for only one car to drive in the street. If I have a car coming in the opposite direction, and if that car has the right of way (if the parked car is on my side of the street), I may not assign a large value for not going first. I am not going to lose any sleep over letting the other guy go in front of me. If there is a tornado behind me, I may assign a larger value as my utility and thus have higher motivation to cut the driver opposite of me, even if he had the right of way. For the game theory enthusiasts, this is a form of game called “Chicken”. As you can imagine, if you do not know the value assigned by the opponent, you may not always make the best move.

Game theory is unfortunately alive and well at the work place as many research studies have shown. Whenever there is a form of negotiation going on there is always a possibility of a non-cooperative situation and this can lead into not so favorable outcomes, as result of the Nash Equilibrium states. A game can have multiple Nash Equilibrium states based on the opponent’s strategy. Here are some key points that can help you in dealing with the traps set by the Nash Equilibrium when you are in a bad spot. The strategies below are geared towards minimizing the imbalance in the games.

  • Tit for Tat:

Believe it or not, the best thing to do in a repeat play game is to be the nice guy first. The strategy Tit for Tat requires you to play what the other player played last. Thus, if he was nice to you first, you play nice in the next game. If he was not nice, you also do not play nice in the next game. Thus, you are forming an immediate feedback loop to the opponent, and directing how the game shall be played. It actually might help to be the kinder person first, putting your best foot forward. This is best played between people with equal standing.

  • Information misdirection:

As I indicated before, if you do not know what the value is assigned by your opponent, your strategy may be futile. Information is gold currency when it comes to playing games. You can signal to your opponent that you value X, while you are after Y. You can also trade key information as needed to gain trust as well. It is also wise to reveal only what is required. A good example is when you play poker.

  • Change the rules:

Simply put, change the rules of the game or the game itself, if you do not like what you are playing. You may try to change how the value is perceived or try to include a new value altogether that changes the initial game. If the venue for the game was telephone, arrange for a face to face meeting.

  • Bring in an authority:

How many times have you said, “I would like to talk to your supervisor”? Nobody can be 100% confident or sure about themselves. Bringing in an authority generally will make the opponent self-conscious and even self-doubting, giving you an advantage.

  • Bring in more people:

Sometimes, it makes sense to bring in more people into the game, even if they are going to be spectators and not going to be on your side. Nobody wants to be seen as the bully or the bad guy. Nonviolent and peaceful protests are examples of this strategy. The press and media are there to catch/witness any misstep that the opponent might take.

  • Look for standards or rules that are applicable:

An easy example here is if you do your homework before going to purchase a car, and inform the salesman that you know the other vendor sells it for much less a price. You can also state your past experience as a guideline of what you are expecting out of the game.

Disclaimer: Please note that this post is purely based on my opinion and not to be used as advice. I shall not be responsible for any possible outcomes. I have not delved into much depth regarding the Nash Equilibrium or Game Theory itself. This is a vast and very interesting topic. I encourage the reader to learn about this fascinating field as much as possible.

Always keep on learning…

An organized mind and a cluttered desk:

Nicolas_P._Rougier's_rendering_of_the_human_brain

Having been immersed in TPS (Toyota Production System) or lean, I have been very interested in seeing how many lean practitioners talk about 5S and the importance of a clean and organized desk. It is almost as if, the clean and organized desk indicates a clean and organized mind – making you a more productive worker. As with everything else, generalization is not always a good thing.

The goal of 5S (or Go-Esu as our Japanese counterparts say) is not to clean and have a tidy work place. The goal of 5S is to ensure that any waste becomes immediately visible. I have delved philosophically about how this applies to an office environment, where the work does not always have routine, efficient and predictable attributes.

My own personal experience has been that having a less than tidy desk never hindered my productivity. Sometimes, the opposite was true. My desk may have piles, but the most important projects/documents are always on the top and close to me. Proximity and the order indicate the importance and timeliness requirement of the project.

My goal has been to have an organized mind first, and then an organized desk. It looks like there has been some research done about the cluttered desks, and this is not truly new news. The goal of this post is not to promote cluttered desks. The goal of this post is to promote organized minds through mindfulness.

Einstein is supposed to have asked, “If a cluttered desk is a sign of a cluttered mind, of what, then, is an empty desk a sign?” The cued answer is a tongue-in-cheek “Empty mind.”

A study conducted in 2013 by Kathleen D. Vohs, a behavioral scientist at the University of Minnesota, indicated that a cluttered desk might actually lead to outside the box thinking by allowing one to veer from the conventionally treaded paths. http://pss.sagepub.com/content/24/9/1860

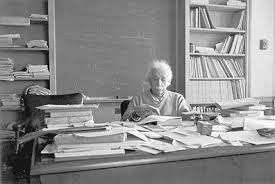
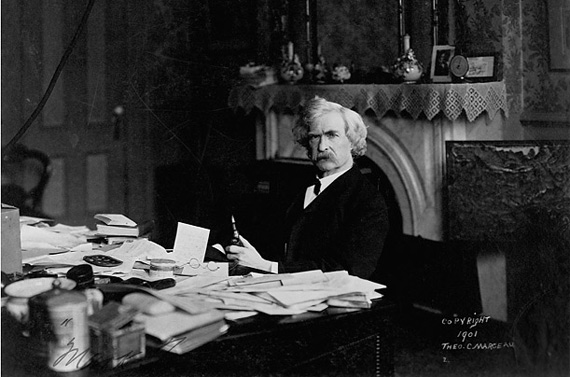
It is true that many great minds have been found to have messy desks.

albert

ALBERT EINSTEIN

jobs-500x333

STEVE JOBS

twain

MARK TWAIN

But as I stated earlier, the goal of this post is not to promote a cluttered desk. 🙂

I have been trying to have a better organized mind through mindfulness practice. The goal of mindfulness practice is to be aware and to be present at the given moment. Surprisingly this has huge benefits in the hustled world that we live in. Check out this link. http://greatergood.berkeley.edu/article/item/three_benefits_to_mindfulness_at_work

Mindfulness helps in improving our emotional intelligence, and helps us being focused on the task at hand. It provides clarity to our minds.

So let us try to organize our minds, getting rid of clutter leading to clarity and focus. And then, have an organized desk. Maybe, a cluttered desk is not that bad after all.

Keep on learning…

The Price of Rice – A fable about leadership

US_long_grain_rice

I heard this story when I was a little kid. Now that I am older, I am not able to trace its source. I think it may have been a Zen story. Anyways, the way I remember it is as follows:

There was a famous teacher in a village. Two brothers came to be trained under him. Years went by, and the older brother was getting restless. In his mind, the teacher was partial to his younger brother, and he could not understand why. He is older and felt wiser than the younger brother. But the teacher never gave him any responsibilities.

One day, the older brother went to his teacher and asked him,

“Teacher, why is it that you do not give me any responsibilities? You always seem to be biased towards my younger brother. We came here at the same time, and learned everything together. Yet, you treat him better than you treat me. Why?”

The teacher smiled. He sipped his tea, and then said,

“Let’s do this; why don’t you run to the village center and go to the rice store. Ask the vendor, what is the price of rice? Come back when you are ready.”

The older brother thought this was an easy job. He ran to the village center and asked the vendor the price for rice, and ran back to his teacher.

“It is 10 rupees per kilo.” He said trying to catch his breath.

The teacher asked him. “Is this the price for brown rice?”

“Yes”. The older brother replied.

“What about the white rice?” The teacher asked.

“I do not know.” The older brother replied.

So he ran back again, and asked the vendor for the price of white rice, and ran back to his teacher.

“It is 12 rupees per kilo.” He replied again trying to catch his breath.

“Is there a price discount, if I buy 10 kilos?” The teacher asked.

“I do not know” was the answer again.

The student ran to the village center yet again to gather more information.

“The price is 8 rupees if we buy 10 kilos.” The student responded.

“What about the white rice?” was the next question from his teacher.

Now the student was too tired to run back again, so he sat down ashamed.

The teacher asked for the younger brother to come. He was unaware of any of the happenings.

“Why don’t you run to the village center and go to the rice store. Ask the vendor, what is the price of rice? Come back when you are ready.” The teacher asked the same thing to the younger brother.

“Sure thing, Teacher”, the younger brother replied.

He ran off and came back after a short while.

“The price of rice is 10 rupees per kilo for brown, and 12 rupees per kilo for white. If you buy 10 kilos, you will get a discount of 2 rupees for both brown and white. The new stock is coming in two days, so we might want to wait to get the fresh supply. The vendor also gave his regards to you.” The younger brother replied.

“Thank you, my son. You may go now”, the teacher said.

The teacher took another sip of his tea, and looked at the older brother, and said.

“When you are given a task, always try to see what the big picture is. Try to understand how your seemingly little task aligns with the big task at hand.”

“Do not be a small person caring about only small things and your own small world. Be a big person caring about both small and big things.” The teacher continued finishing his tea.

THE END.

Soon after joining the work force, I came to the realization that I have to move in and out of the big and small picture perspectives. A task or a project sometimes seems to live on even after you are done with it, and it is generally intertwined with multiple other projects. Thus I learned to keep my mind at the task at hand, while keeping my eyes on the big picture.

To me, the younger brother also ensured to maintain a personal interaction with the rice vendor. This is also an important thing to keep in mind.

Always keep on learning, and be ready when you are next asked what the price of rice is.

Evolution of Hypothesis Testing

hypo

This is the second post in the series of “Let’s not hypothesize.” The first post is available here.

This post is written to have a brief look at how the Hypothesis testing seen in most Statistics texts came into being.

My main sources of information are;

1) The empire of Chance

2) The lady tasting tea, and

3) Explorations in statistics: hypothesis tests and P values

I have the evolution separated into three phases.

1) Pre-Fisher:

The Explorations in statistics: hypothesis tests and P values provides a date of 1279 as the origin of Hypothesis testing. The Royal Mint from London used a sample of coins made from each run of the mint which were compared against a known set of standards. I welcome the reader to click on the third reference given above to read this in more detail.

gosset

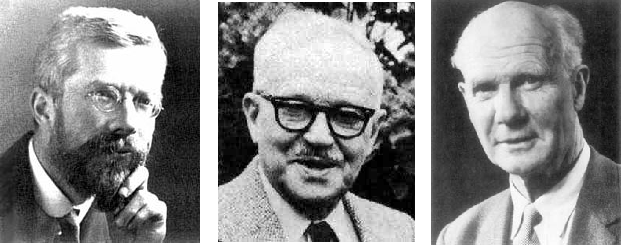
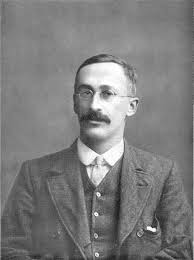
The article also speaks about William Sealy Gosset (Student) and his t-test method. What struck me most was the description of Gosset explaining the significance of a drug in terms of an odds ratio. This was well before the advent of p-values to determine significance of the data.

First let us see what is the probability that [drug A] will on the average give increase of sleep. [Looking up the ratio of the sample mean to the sample standard deviation] in the table for ten experiments we find by interpolating. . .the odds are .887 to .113 that the mean is positive. That is about 8 to 1 and would correspond to the normal curve to about 1.8 times the probable error. It is then very likely that [drug A] gives an increase of sleep, but would occasion no surprise if the results were reversed by further experiments.

2) Sir Ronald Fisher:

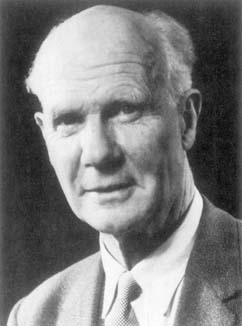
200px-R._A._Fischer

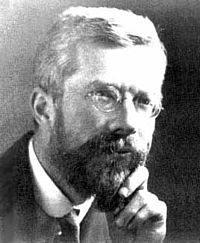
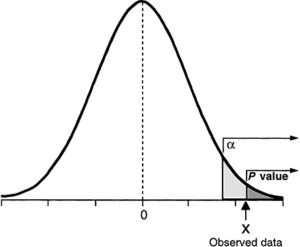
It was Sir Ronald Fisher who clearly came up with the idea of a null hypothesis (H0) and the use of a conditional probability p-value to make a decision based on the data found. He termed this as “Significance Testing”. The main distinction here from the texts today, is that Fisher only used Null or Nil Hypothesis. He did not find value in the alternate hypothesis. His thought process was that if the p-value was less than a cut-off point (let’s say .05), this would indicate that either this was due to a very rare event or that the null hypothesis model was wrong. More than likely, it is highly probable that the null hypothesis model was wrong. Fisher did not see a need for an alternate hypothesis nor the need for repeating tests to see how powerful the test was.His method is based on Inductive Inference.

Fisher never also meant to use only .05 as the cut-off value. He viewed p-values as inductive evidence against the null hypothesis.

If one in twenty does not seem high enough odds, we may, if we prefer it, draw the line at one in fifty (the 2 per cent. point), or one in a hundred (the 1 per cent. point). Personally, the writer prefers to set a low standard of significance at the 5 per cent. point, and ignore entirely all results which fail to reach this level. A scientific fact should be regarded as experimentally established only if a properly designed experiment rarely fails to give this level of significance.

3) Neyman-Pearson Hypothesis Testing:

Jerzy_Neyman2Pearson_Egon_3

The books “Lady tasting tea” and “The empire of chance” go into detail about the “feud” between the great minds Fisher, and Neyman/Pearson.

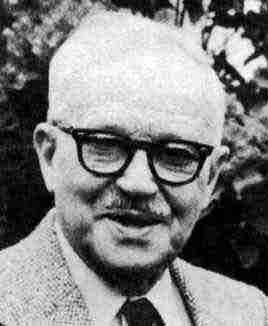
It was Neyman and Pearson who came up with idea of using an alternate hypothesis (H1) and testing it against the null hypothesis. Additionally, they also created the idea of the power of a test, and introduced the ideas of type I and type II errors. They termed their version as Hypothesis testing.Their version is based on inductive behavior.

They defined alpha, beta and power as follows.

alpha = P(reject H0|H0 is true)

beta = P(fail to reject H0|H0 is false)

power = 1 – beta

Where we are now:

What we use and learn these days is a combined method of Fisher and Neyman/Pearson. The textbook method is generally as follows;

1) define null and alternate hypotheses.

2) set an alpha value of .05, and power value of .80 before the experiment.

3) calculate test statistic and p-value based on the data collected.

4) Reject or retain (fail to reject) null hypothesis based on the p-value.

Critiques of this combined method claim that the combined method utilizes the worst of the two methods. They emphasize the focus on effect size, and the use of confidence intervals to provide better view of the problem at hand, rather than blindly relying on the p-value alone.

Keep on learning…

Let’s not hypothesize – Part 1

8FF3

Over the last few months, there has been a lot of frenzy in a small portion of the blogosphere over the “ban of P-values” by the Psych magazine  Basic and Applied Social Psychology (BASP). You can read the full editorial here.

http://www.tandfonline.com/doi/pdf/10.1080/01973533.2015.1012991

My goal is to create a series of posts covering the items discussed in the editorial. This will include talking about the evolution of hypothesis testing, p-values and confidence intervals.

Some of the highlights from the editorial are below.

1) p < .05 is too easy and leads to low quality papers:

we believe that the p < .05 bar is too easy to pass and sometimes serves as an excuse for lower quality research.

There has been a lot of papers about the traditional approach of using p < .05 or even <.01 as being arbitrary values. I welcome the reader to check out this webpage by Chris Fraley, which has a collection of articles and papers about Null Hypothesis Significance Testing (NHST) and p-values.

http://www.uic.edu/classes/psych/psych548/fraley/

2) Confidence Intervals are no better either:

Analogous to how the NHSTP fails to provide the probability of the null hypothesis, which is needed to provide a strong case for rejecting it, confidence intervals do not provide a strong case for concluding that the population parameter of interest is likely to be within the stated interval.

To me, this is very interesting. I have always relied on confidence intervals to get a bound on the uncertainty around my statistic. The magazine banned the use of Confidence Intervals as well.

Interestingly enough, Bayesian procedures are not “banned”.

Bayesian procedures are neither required nor banned from BASP.
I will be very interested in seeing how this impacts the other fields outside Social Psychology. It is true that many scholars have challenged the idea of using p-values, and offered suggestions to include power, confidence intervals, etc. But this editorial challenges all of that.
Keep on learning…

Making a loaded coin fair – The Unfair Coin Problem

Today’s post is about Game Theory.

460px-JohnvonNeumann-LosAlamos

How do you make a loaded coin fair for a coin toss?

Let’s say that the coin is loaded such that heads comes up 75% of the time, and tails 25% of the time. How would one use this coin fairly for a coin toss?

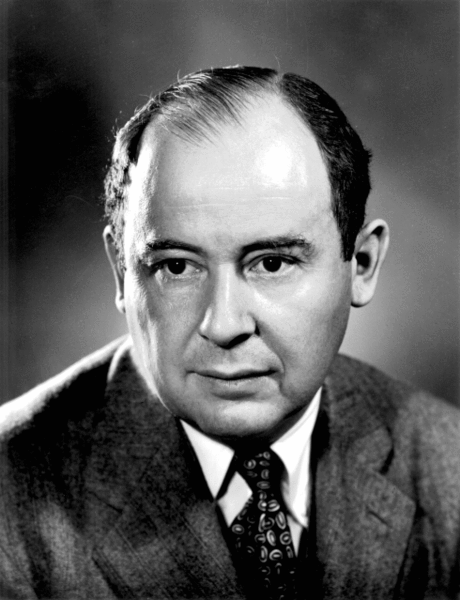
Enter Jon Von Neumann, the father of Game Theory. His solution was elegant and simple;

Flip the coin twice. If the results are the same (HH or TT), ignore and proceed to flipping them two more times. If the two results are different (HT or TH), use the first of the two results. That is it.

The rationale is that p(H) * p(T) = p(T) * p(H), where p(H) is the probability for heads and p(T) is the probability for Tails. Thus, the probability of two consecutive different results is simply the product of the two.

Since p(H) * p(T) = p(T) * p(H), this now becomes a 50-50 chance. Voila, a fair coin toss rule.

This solution is as elegant as the Tit-for-tat solution for the iterated Prisoner’s dilemma question.

This also reminds me of a great quote from Taligent’s Guide to Designing Programs!

Remember that there is no code faster than no code.

Keep on learning…

Reliability/Confidence Level Calculator (with c = 0, 1….., n)

rel

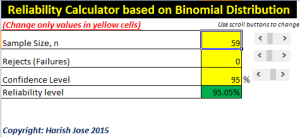
The reliability/Confidence level sample size calculation is fairly known to Quality Engineers. For example, with 59 samples and 0 rejects, one can be 95% confident that the process is at least 95% reliable or that the process yields at least 95% conforming product.

I have created a spreadsheet “calculator”, that allows the user to enter the sample size, number of rejects and the desired confidence level, and the calculator will provide the reliability result.

It is interesting to note that the reliability/confidence calculation, LTPD calculation and Wilk’s first degree non-parametric one sided tolerance calculation all yield the same results.

I will post another day about LTPD versus AQL.

The spreadsheet is available here Reliability calculator based on Binomial distribution.

I have a new post in this topic. Check out https://harishsnotebook.wordpress.com/2019/10/19/aql-rql-ltpd-oc-curve-reliability-and-confidence/

Keep on learning…

Spock and Genchi Genbutsu

thatwhich

I am a big fan of Spock, a key character from the classic Star Trek show. He is a great inspiration for me, and I have already written a post about him here.

Recently, I came across another gem from him that I would like to share.

This is taken from the episode “That Which Survives.”

SPOCK: I note it, Mister Scott, without necessarily understanding it. I propose to run an analysis through the ship’s computers, comparing the present condition of the Enterprise with her ideal condition.

This in my eyes is a good example of Genchi Genbutsu via Grasping the Current Condition. Spock came across a potential problem on the star ship, and he is using the scientific approach to first understand the problem.

If you do not know the ideal state, how will you know what the scope of the problem is?

One should always know the ideal state. This is a form of calibration, a way to know if there is indeed a problem or if it is a false alarm. Humans tend to exaggerate when they try to approximate. When the entirety of data is lacking, one has to approximate, and this can lead him/her to underestimate a threat or overestimate a gain.

Do you know your ideal state at work? At home?

Always keep on learning…