
In today’s post, I am looking at the relationship between capability index (Cpk or Ppk) and Tolerance Intervals. The capability index is tied to the specification limits, and tying this to the tolerance interval allows us to utilize the confidence/reliability statement allowed by the tolerance interval calculation.
Consider the scenario below:
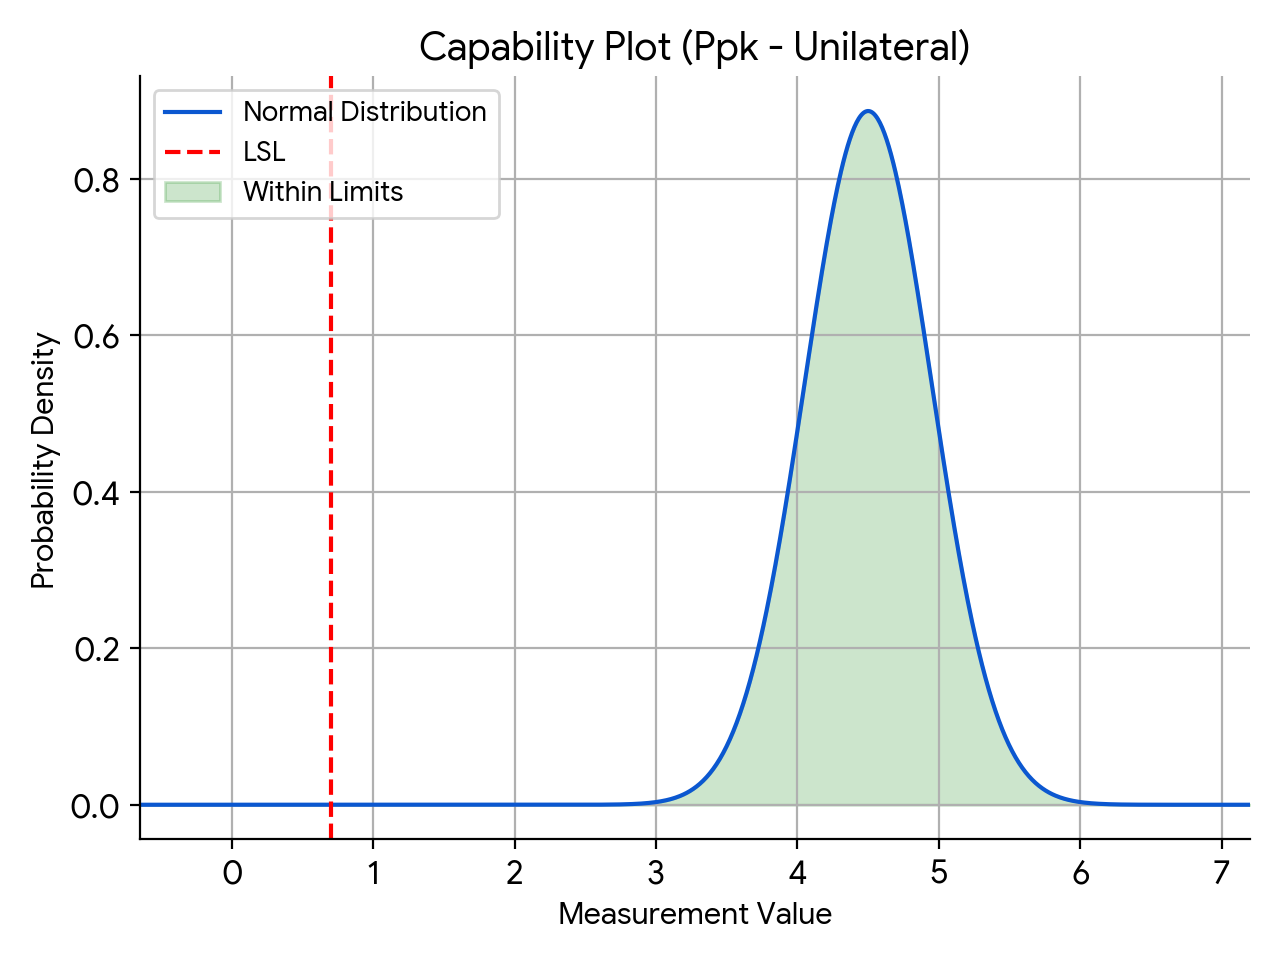
A quality engineer is tasked with assessing the capability of a sealing process. The requirement the engineer is used to is that the process capability index, Ppk, must be greater than or equal to 1.33. The engineer is used to using 30 as the sample size.
But what does this really tell us about the process? Is 1.33 expected to be the population parameter? If so, does testing 30 samples provide us with this information? The capability index calculated from 30 samples is only the statistic and not the parameter.
We can utilize the tolerance interval calculation approach here and calculate the one-sided k-factor for a sample size of 30. Let us assume that we want to find the tolerance interval that will cover 99.9% of the population with 95% confidence. NIST provides us a handy reference to calculate this and we can utilize an Excel spreadsheet to do this for us. We see that the one-sided k-factor calculated is 4.006.
The relationship between the required Ppk and the one-sided k-factor is as follows:
Ppkrequired = k1/3
Similarly for a bilateral specification, the relationship between the required Ppk and the two-sided k-factor is:
Ppkrequired = k2/3
In our example, the required Ppk is 1.34. In other words, if we utilize a sample size of 30 and show that the calculated Ppk is 1.34 or above, we can make the following statement:
With 95% confidence, at least 99.9% of the population is conforming to the specifications. In other words, with 95% confidence, we can claim at least 99.9% reliability.
This approach is also utilized for variable sampling plans. However, please do note that the bilateral specification also requires an additional condition to be met for variable sample plans.
I have attached a spreadsheet that allows the reader to perform these calculations easily. I welcome your thoughts. Please note that the spreadsheet is provided as-is with no guarantees.
Final words:
I will finish with the history of the process capability indices from a great article by Roope M. Turunen and Gregory H. Watson. [1]
The concept of process capability originated in the same Bell Labs group where Walter A. Shewhart developed SPC. Bonnie B. Small led the editing team for the Western Electric Statistical Quality Control Handbook, but the contributor of the process capability concept is not identified. The handbook proposes two methods by which to calculate process capability: first, “as a distribution having a certain center, shape and spread,” and second, “as a percentage outside some specified limit.” These methods were combined to create a ratio of observed variation relative to standard deviation, which is expressed as a percentage. The handbook does not call the ratio an index; this terminology was introduced by two Japanese quality specialists in their 1956 conference paper delivered to the Japanese Society for Quality Control (JSQC). M. Kato and T. Otsu modified Bell Labs’ use of percentage and converted it to an index, and proposed using that as a Cp index to measure machine process capability. Subsequently, in a 1967 JSQC conference paper, T. Ishiyama proposed Cpb as a measurement index of bias in nonsymmetric distributions. This later was changed to Cpk, where “k” refers to the Japanese term katayori, which means “offset” or “bias.”
Always keep on learning…
My last post was All Communication is Miscommunication:
[1] Analyzing the capability of lean processes by Roope M. Turunen and Gregory H. Watson (Quality Progress Feb 2021)
Discover more from Harish's Notebook - My notes... Lean, Cybernetics, Quality & Data Science.
Subscribe to get the latest posts sent to your email.

One thought on “Ppk, Capability Index and Tolerance Interval Relation:”